Plotly
The Plotly modules allow you to create, update, and/or delete graphs in your Plotly account.
Prerequisites
- A Plotly account
In order to use Plotly with Boost.space Integrator, it is necessary to have a Plotly account. If you do not have one, you can create a Plotly account at https://chart-studio.plot.ly/Auth/login/?action=signup#/.
The module dialog fields that are displayed in bold (in the Boost.space Integrator scenario, not in this documentation article) are mandatory!
Connecting Plotly to Boost.space Integrator
To connect your Plotly account to Boost.space Integrator, you need to obtain your Username and API Key.
1. Log into your Plotly Account.
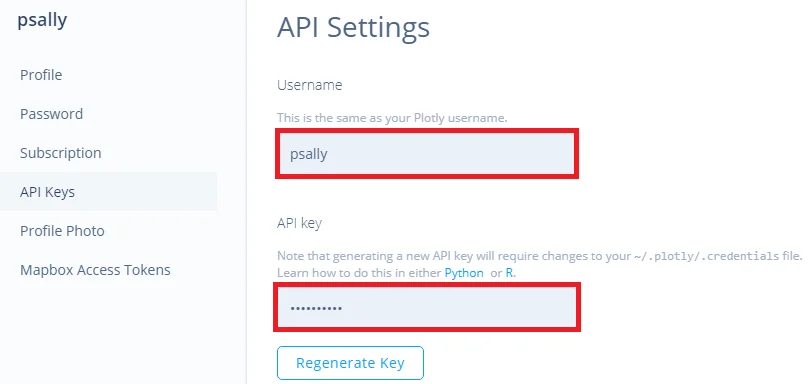
2. Click the Profile icon ->Settings ->API Keys.

3. Copy the Username and API Key.
4. Go to Boost.space Integrator and open the Plotly module’s Create a connection dialog.

5. Enter the Username and API Key you copied in step 3.
6. Click Continue.
The Connection has been established.
Actions
Create a Graph
Creates a new Plotly graph.
Connection
Establish a connection to your Plotly account.
File Name
Enter the graph name.
File Options
Select the file options for the graph:
-
New
-
Overwrite
-
Append
-
Extend
Graph Type
Select the type of graph you want to create:
-
Scatter plot
-
Histogram
-
Bar Chart
X Axis Title
Enter a name for X-Axis.
X Axis Type
Select the X-Axis type:
-
Linear
-
Logarithmic
Y-Axis Title
Enter a name for Y-Axis.
Y Axis Type
Select the Y-Axis type:
-
Linear
-
Logarithmic
Delete a Graph
Deletes an existing graph.
Connection
Establish a connection to your Plotly account.
Graph ID
Select the Graph ID you want to delete.
Create a Graph Image
Creates a graph image based on specified parameters.
Connection
Establish a connection to your Plotly account.
Format of the graph figure you want to generate
Select the format of the graph image you want to create:
-
jpeg
-
png
-
pdf
-
eps
-
webp
Figure Width
Enter the image width in pixels.
Figure Height
Enter the image height in pixels
Graph Type
Select the type of graph you want to create:
-
Scatter plot
-
Histogram
-
Bar Chart
X Axis Title
Enter a name for X-Axis.
X Axis Type
Select the X-Axis type:
-
Linear
-
Logarithmic
Y Axis Title
Enter a name for X-Axis.
Y Axis Type
Select the Y-Axis type:
-
Linear
-
Logarithmic
Legacy article, imported from the original Boost.space knowledge base (/knowledge-base/applications/business-intelligence/plotly/).

